
Decision Intelligence for Public Works: How AI + MIS Cut Cost Overruns and Delays
Theme: Public Sector · Project Delivery · Decision Intelligence
Public WorksAI + MISScheduleProcurement
Big public projects are complex—multiple agencies, shifting requirements, supply constraints, political timelines, and millions (or billions) at stake. What consistently derails them isn’t one catastrophic mistake; it’s hundreds of small, uncoordinated decisions made with partial data. Decision intelligence changes that. By unifying AI models with a clean Management Information System (MIS) backbone, agencies can move from reactive firefighting to proactive control—reducing cost overruns, compressing schedules, and improving accountability.
The problem isn’t data—it’s decision flow
Most departments already collect mountains of data: procurement logs, contractor progress reports, safety audits, weather and traffic feeds, and budget burn rates. But these live in silos and arrive on different cadences. Project managers then stitch together weekly slides, inevitably introducing delays and blind spots. AI + MIS fixes the “last-mile” of decision-making: it pulls live data into a single source of truth, translates signals into risks and recommendations, and routes decisions to the right owner before issues snowball.
What decision intelligence looks like in practice
- Live risk scoring, not monthly surprises. ML models track leading indicators—unit costs, crew productivity, change-order velocity, and idle equipment time—to flag variance early. Instead of discovering a 12% overrun at month-end, managers get a “cost-drift” alert today, with the drivers and a suggested mitigation plan.
- Schedule compression with constraint-aware optimization. AI evaluates resource conflicts, permit windows, and supplier lead times, then proposes re-sequencing that yields real days saved—without breaking safety or compliance rules.
- Procurement resilience. When a vendor slips, the system auto-simulates alternatives using historical performance, on-time delivery rates, and price volatility. Decision-makers see the trade-offs clearly—pay a 2% premium now or risk a 3-week delay that impacts the critical path.
- Closed-loop accountability. Every recommendation is tied to an owner, deadline, and measurable outcome. The MIS keeps a clean audit trail of decisions, so progress reviews shift from “what happened?” to “what did we decide and did it work?”
Why this cuts costs—mechanically
- Earlier detection = cheaper fixes.
- Less variance, fewer change orders.
- Higher utilization of constrained resources.
- Better vendor performance with transparent scorecards.
Implementation in three steps
- Data foundation. Connect ledger, schedule (WBS), daily progress, procurement milestones, and quality/safety reports with common IDs.
- Decision apps. Start with cost variance prediction and schedule re-sequencing; deliver simple dashboards with accept/modify/reject actions and auto-logging.
- Operating rhythm. Weekly risk reviews where recommendations drive decisions, and decisions update the plan—no side spreadsheets.
The outcome
Agencies adopting decision intelligence report fewer late-stage surprises, smoother stakeholder reviews, and measurable savings from avoided delays and disputed change orders. In a world where public trust depends on visible outcomes, AI + MIS is not a flashy add-on—it’s the control system that keeps complex projects on time and on budget.
↑ Back to top
From MVP to Federal Integration: NeuroChain’s 10-Year Roadmap Explained
Theme: Strategy · Public Sector · Platform
RoadmapStandardsInteroperability
Public-sector innovation dies in the gap between a clever demo and a dependable system. This roadmap closes that gap. Over ten years, NeuroChain evolves from a focused MVP into a standards-compliant, federally integrated decision-intelligence platform that agencies can trust for mission-critical work.
Years 0–1: Build a razor-sharp MVP
Start small and valuable—cost variance prediction and schedule re-sequencing. Clean connectors, compact models, and tight metrics: <10-minute latency, >85% precision, fewer last-minute change orders.
Years 2–3: Multi-agency pilots and “decision apps”
Scale across agencies; build accept/modify/reject into the workflow with immutable decision trails and governance as a product feature.
Years 3–5: Regional scaling and interoperability
Open schemas, APIs, event streams, least-privilege RBAC, and a trust layer (model cards, bias testing, lineage). FedRAMP-aligned controls and continuous monitoring.
Years 5–7: Sector expansion and standards leadership
Move into supply-chain resilience, asset performance, grants; contribute to data standards; add simulations to quantify policy trade-offs.
Years 7–10: Federal integration and nationwide adoption
Shared, modular platform with secure tenants and cross-agency analytics; federated learning for improvement without centralizing sensitive data; config-not-custom procurement.
What changes day-to-day
- Fewer surprises, earlier mitigations.
- Cleaner accountability with owners and deadlines.
- Resilience by design: interoperable data, robust security, explainable models.
This roadmap isn’t about more dashboards—it’s a repeatable machine for better public decisions.
↑ Back to top
Predictive Supply Chain Risk Management for U.S. Reshoring: A Practical Playbook
Theme: Manufacturing · Logistics · Resilience
ReshoringRiskForecasting
1) Map what really matters (SKUs, tiers, constraints)
Trace critical SKUs at least two tiers deep; identify true constraints (machines, certified lines, inspectors, choke points).
2) Centralize live signals into one model
Unify POs, ASN/EDI, telematics, MES, inventory, maintenance alarms, plus external feeds (weather, closures, labor actions, commodities).
3) Predict early and explain the “why”
- Arrival risk · Supply health · Throughput risk
Pair predictions with top drivers so planners trust and act.
4) Turn predictions into decisions
Ship recommendations, not alerts. Assign an owner and due date, and capture outcomes for learning.
5) Scenario and stress testing
Pre-run “what-ifs” (rail delay, tier-2 outage, demand surge) and pre-approve playbooks for click-to-commit response.
6) Policies that absorb shocks
- Dual-qualify alternates; keep PPAP/FAI current.
- Dynamic safety stock tied to volatility & lead time.
- Risk-indexed contracts and visibility SLAs.
- Capacity buffers on constrained assets.
7) Prove ROI and keep score
Track avoided line-stops, expedite cost prevented, perfect-order gains, and forecast bias reduction.
8) A 90-day rollout blueprint
- Days 1–30: pick 5–10 SKUs and one region; wire data; ship an arrival-risk model + action queue.
- Days 31–60: add supplier-health signals, alt-source routing, stress-test sandbox.
- Days 61–90: expand scope; dynamic safety stock; weekly risk review.
Reshoring succeeds when planning is predictive and decisions are routinized.
↑ Back to top

Human–AI Copilots for Executives: Building Trustworthy Decision Support
Theme: Leadership · Copilots · Governance
ExplainabilityConfidencePlaybooks
What “trustworthy” really means
- Why: top drivers (“lead times increasing,” “quality drift,” “burn above plan”).
- What if: one-click counterfactuals for alternatives.
- How sure: confidence bands & data freshness.
- What changed: deltas since last review.
- Who owns it: action owner + deadline + KPI.
The copilot stack
- Data foundation (MIS): clean entity models + live connectors.
- Intelligence layer: forecasting, anomalies, optimization, simulation—documented and monitored.
- Interaction layer: NL queries, accept/modify/reject, saved playbooks.
- Governance & security: RBAC, lineage, incident response, FedRAMP-like controls.
Guardrails that keep humans in command
- Policy constraints built into optimizations.
- Human-in-the-loop overrides with rationale.
- Red-team testing for robustness.
- Separation of duties for high-risk actions.
Value you can measure
- Decision cycle time, acceptance rate, override win rate.
- Outcome lift: avoided expedites, variance reduction, on-time delivery.
- Compliance health: audit completeness, lineage, drift incidents.
A 90-day executive rollout
- Days 1–30: pick two weekly decisions; connect minimal data.
- Days 31–60: ship explanations, confidence, what-ifs; add owner routing.
- Days 61–90: add policy constraints, approvals, governance review, and a scorecard.
Mindset: a copilot doesn’t replace expertise—it amplifies it.
↑ Back to top
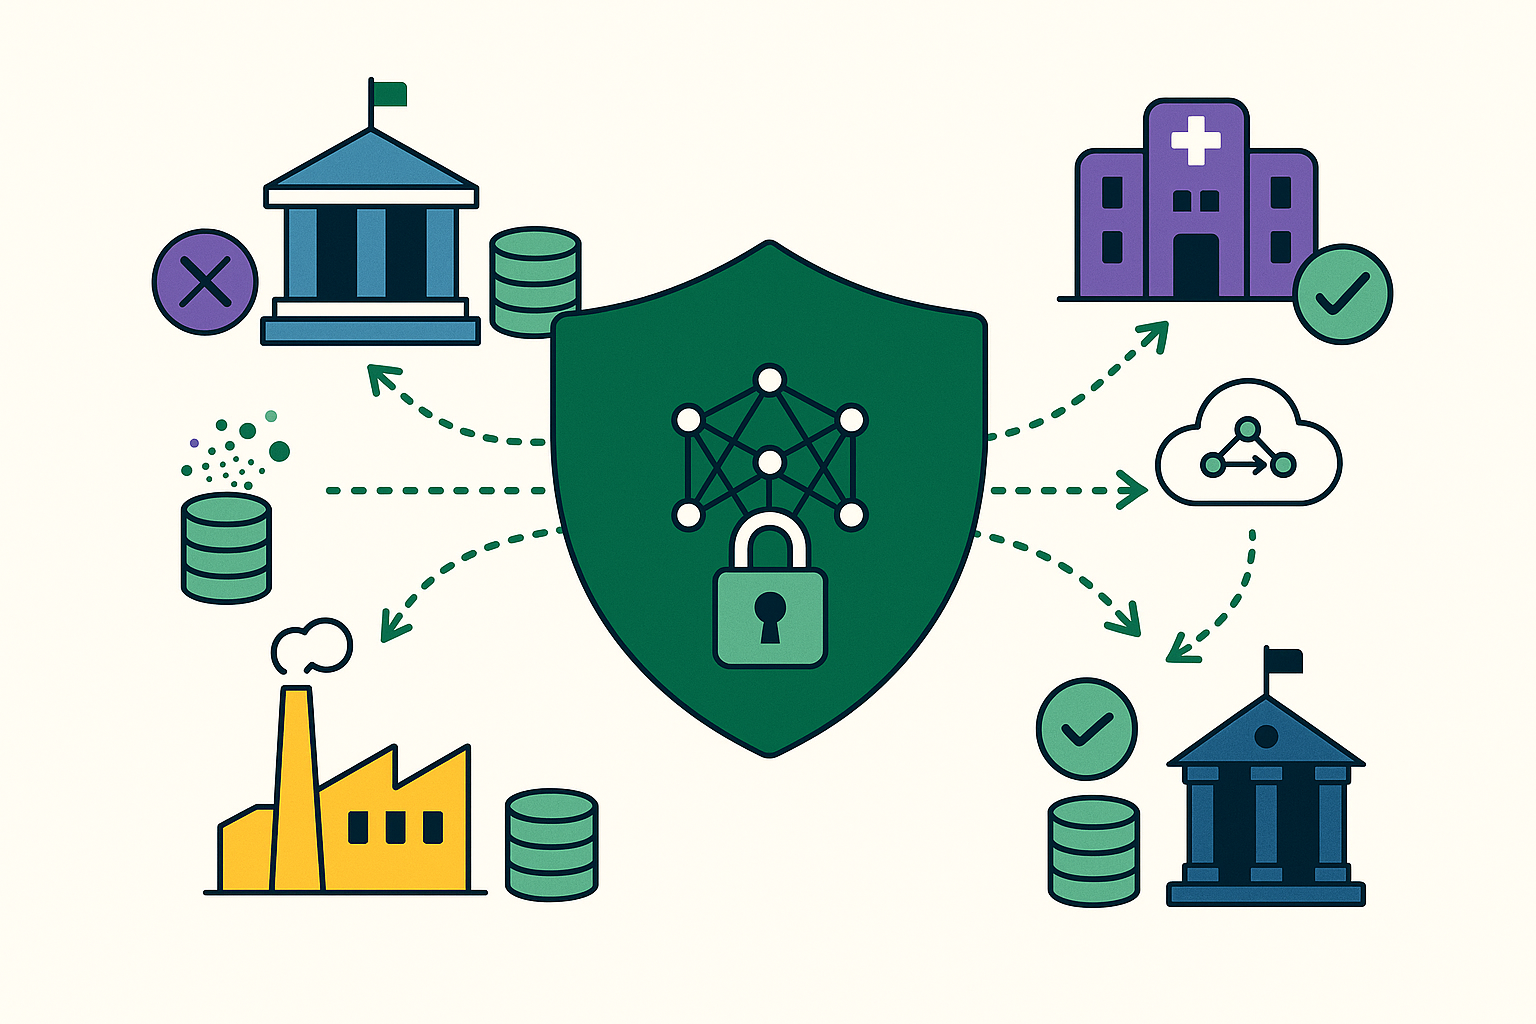
Securing Public–Private Data Collaboration with Federated Learning—Without Sharing Raw Data
Theme: Privacy · Collaboration · ML
Federated LearningDifferential PrivacySecure Aggregation
How federated learning works (plain English)
Each participant trains locally and shares only model updates. A coordinator aggregates updates into a stronger global model—no raw data leaves the premises.
Privacy and security guardrails
- Secure aggregation so no single update is exposed.
- Differential privacy via noise/clipping to resist inference.
- Policy enforcement that encodes HIPAA/PII and supplier confidentiality.
- Audit & lineage for every training round.
Threats and fixes
- Data poisoning/outliers → robust aggregators and update anomaly detection.
- Non-IID data/drift → per-site personalization + scheduled evaluation.
- Limited nodes → split learning, secure enclaves, or PPRL.
A practical 90-day rollout
- Days 1–30: define outcome, align schema, stand up coordinator + one client; baseline with synthetic/public data.
- Days 31–60: enable secure aggregation & DP; publish model cards; add evaluation dashboard (metrics only).
- Days 61–90: expand to 8–10 nodes; add MOUs/DPAs, risk registry, incident playbook; wire predictions into a decision app.
What to measure
- Model quality (AUC/MAE) and cross-site fairness.
- Privacy posture (ε, % rounds secured, zero raw transfers).
- Operational value (avoided loss, review time reduction, acceptance rate).
- Reliability (round success rate, time/round, drift incidents closed).
When not to use FL: misaligned schemas, too few samples, or heavy centralized feature engineering—start with enclaves, then graduate to FL.
With the right guardrails, teams share intelligence—not data—and still get better models with defensible privacy.
↑ Back to top